Entrepreneur and Business Resources
Integral Methods and Technology
Governance and Investor Responsibility
|
Historical Perspective - US Market Returns Over 130 Years
from Vanguard. www.vanguard.com
Not only is the reversal following bear markets typically sharp—it also tends to be sustained. This analysis looks at U.S. stock and bond returns over the past 130 years, as well as the cause of bear markets—typically associated with sharp contractions in equity valuations. Particular attention is paid to the 2000–2001 downturn and to the details of previous recoveries.
This historical perspective focuses on this contrast
of extremes. We look at the 2000–2001 bear market in the context
of past bear markets, and in the context of the unprecedented prosperity
that preceded it. In the first section of the paper we reflect on the
decade of the 1990s to see how it compared to the prior 12 decades in
terms of capital market performance. The second section compares the current
downturn with the magnitude, duration, and causes of past bear markets.
We also attempt to draw lessons from past recoveries, which have proved
just as extraordinary as the declines.
The 1990s
Stock returns
From 1990 through 1999 stocks returned 18.2%
on an annualized basis. The 1990s proved to be the second best decade
for investing in stocks since the Civil War, exceeded only by the 19.5%
return over the 1950s (Figure 1). The decade of the 1990s was the
fourth of the past 13 in which stock returns exceeded 10%. The other 3
were the 1920s, the 1950s, and the 1980s.
Figure 1
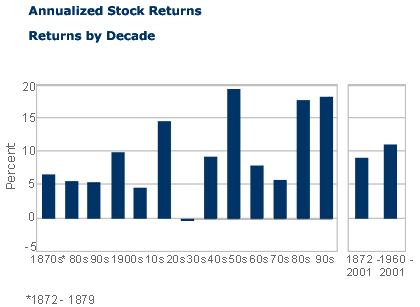
The rate of equity appreciation over the 1990s
was roughly double the long-term average return from stocks. From 1872–2001,
stocks have achieved an annualized compound return of 9.1%. Dividend payouts
(income return) accounted for 4.8% of this long-term return, while earnings
growth contributed 3.5% to annualized stock price appreciation; the remaining
0.8% of the 9.1% total return can be attributed to valuation expansion
(Figure 2). Over the 130-year period, annualized real earnings
growth was 1.2% and price/earnings (P/E) ratios roughly tripled, from
13.7x in 1872 to an estimated level of 42.7 in December 2001.
Figure 2
Components of Equity Returns* |
||||
|
Total Return |
Income Return |
EPS (1) Growth |
Valuation Change |
1872–2001 |
9.1% |
4.8% |
3.5% |
0.8% |
1960–2001 |
11.0% |
3.7% |
5.1% |
2.2% |
Decades |
||||
1872–1879 |
6.5% |
6.0% |
–1.1% |
1.7% |
1880s |
5.6% |
4.8% |
–1.1% |
1.9% |
1890s |
5.5% |
4.2% |
5.0% |
–3.7% |
1900s |
9.9% |
4.3% |
5.6% |
0.0% |
1910s |
4.5% |
5.7% |
2.0% |
–3.2% |
1920s |
14.6% |
5.3% |
5.7% |
3.6% |
1930s |
–0.1% |
5.3% |
–5.7% |
0.3% |
1940s |
9.2% |
6.2% |
9.9% |
–7.0% |
1950s |
19.5% |
5.8% |
3.9% |
9.7% |
1960s |
7.8% |
3.4% |
5.5% |
–1.1% |
1970s |
5.7% |
4.3% |
9.9% |
–8.5% |
1980s |
17.5% |
4.9% |
4.5% |
8.1% |
1990s |
18.2% |
2.7% |
7.8% |
7.7% |
Since 1960, stock returns achieved an overall
return of 11.0%. When compared to the total period, the mix shift between
the components of return has been dramatic over the past 42 years. Dividend
payouts have only contributed 3.7% to total returns, while earnings growth
has expanded at an annualized rate of 5.1% on a nominal basis. Real earnings
growth was 0.7% over the period. Valuation expansion contributed a further
2.2% to annualized stock returns since 1960, when stock prices were 17x
earnings.
The composition of returns in the 1990s had
a similar pattern to the 1920s, 1950s, and 1980s, the 3 other decades
with outstanding stock returns; all were driven by a significant expansion
in P/E ratios. The 1990s ranked as the third best decade in terms of valuation
expansion. P/E expansion contributed 7.7% to annualized stock returns
over the decade as P/E ratios rose from 14x in 1989 to 31x in 1999. P/E
expansion contributed 9.7% and 8.1% to the annualized stock returns of
the 1950s and the 1980s, respectively, the 2 best decades for valuation
expansion.
Each period of valuation expansion was associated
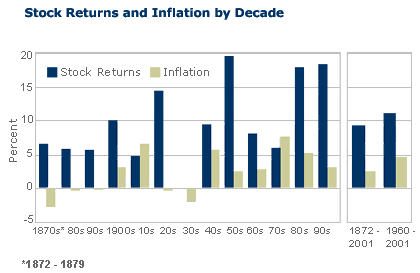
with disinflation and falling interest rates. In fact, the 4 best decades
for stock returns followed the 4 worst decades for inflation (Figure
3). The inflation shocks of World War I (WWI), World War II (WWII),
and the 1970s oil crisis all led to high inflation levels in their respective
decades. The 1980s, perhaps surprisingly, ranked as the decade with the
fourth highest average inflation rate. While the modest 2.9% inflation
rate of the 1990s seemed exceedingly low, the 1990’s ranked 6th
highest in terms of inflation. Fully 5 of the 13 decades experienced deflation
(negative average inflation rates).
Figure 3
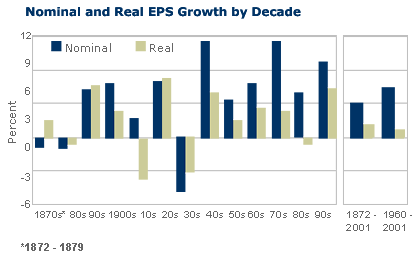
The 1990s compares well in terms of earnings
growth, ranking third best among the 13 decades on both a real and nominal
basis (Figure 4). Nominal earnings grew at an annualized rate of
7.8% over the decade, and 4.9% after adjusting for inflation. However,
an estimated decline of more than 45% in reported earnings in 2001 implies
the largest single annual decline in earnings since 1930. Since 1872,
nominal earnings have grown at a 3.5% (1.2% real) rate on a reported basis,
and 3.9% (1.6% real) on an operating basis. Since 1960, nominal reported
earnings have grown at a 5.1% (0.7% real) pace, while operating earnings
grew at a 6.4% (1.9% real) rate.
Figure 4
The 1990s turned in the lowest income return
of the 13 decades, at just 2.7%. Over the past 20 years, dividend yields
on stocks have trended downward. In 1982 the income return to stocks was
6.7%. By 1993 it reached 3.0%, and in 2000 it reached a record low of
1.0%. This trend is related to several factors. The most obvious reason
for falling dividend yields has been the strong rise in equity prices
over the last 20 years. Since the pace of stock price appreciation has
exceeded the pace of dividend growth, dividend yields have declined. In
addition, the increased weight of technology stocks in the indexes resulted
in lower dividend yields since technology companies typically reinvest
their earnings rather than paying dividends. Finally, in recent periods
many companies have opted to buy back stock with earnings rather than
to pay them out as dividends.
Stock returns in the 1990s doubled the long-term
rate of return on stocks through both strong earnings growth and strong
P/E expansion. Historically, this has proved a rare combination. The only
other decade to have both above average real earnings growth and valuation
expansion was the 1920s. The market decline in 2000–2001 has now
pared back most of this above-average performance. The annualized return
to equities since 1990 has now been reduced from 18.2% (at the end of
1999) to 12.9% (at the end of 2001).
Bond returns
Not only were the 1980s and the 1990s the first
back-to-back decades where equity returns exceeded 10%, they were also
the 2 best decades for nominal bond returns since our bond data set starts
in 1901 (Figure 5). Unlike the sharp reversal experienced in the
stock market over the past 2 years, the bond market has yet to experience
a sharp reversal of fortunes.
Figure 5
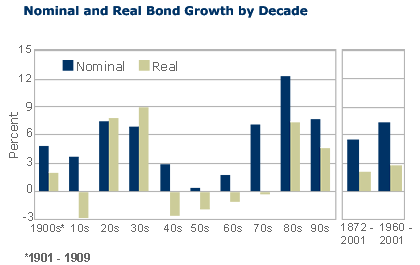
Since 1901 bonds have achieved a compound annual
return of 5.5%, and a real return of 2.0%. The 1990s ranked as the second
best decade for nominal bond returns, at 7.7%, and the fourth best decade
for real bond returns, at 4.8%. The strongest decade for real bond returns
was the 1930s, at 9.0%. After this strong performance in the 1930s, real
bond returns were negative for 4 straight decades from the 1940s through
the 1970s.
Reflections on the
2000–2001 downturn
Bear market severity
From the peak in March 2000 to the trough in
September 2001, the equity market declined 30%. This puts the current
decline in line with the median of the 16 other bear markets (defined
as a 20% decline) since 1872, and in line with the 30% decline during
the crash of 1987 (Figure 6). However, it has been much more severe
than the 2 most recent downturns associated with the 1997–1998 Asian
financial crisis and the recession in 1990–1991 triggered by the
Gulf War (neither of which qualified for bear market status).
Figure 6
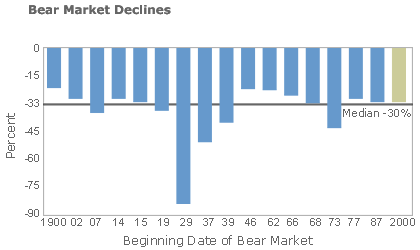
While significant, the 2000–2001 decline
falls well short of the most severe declines. The worst market decline
occurred during the Great Depression, where stocks fell 83% from August
1929 through June 1932. Since WWII, the worst decline in the market was
the 43% drop between January 1973 and September 1974. In the post-war
era, bear markets have become less severe and less frequent. Of the 16
prior bear markets since 1900, only 6 occurred in the last half of the
century or roughly once every eight and a half years. For the first 50
years of the 1900s, the market averaged one bear market every 5 years.
The median decline in bear markets over the last 50 years has been 28%,
compared with a 32% median decline for bear markets during the previous
50 years, 1900–1950.
Greater stability in the equity markets mirrors
the increased stability in levels of economic growth and inflation. This
stability can be traced largely to 3 developments, each related to the
lessons learned during the Great Depression. First, the effectiveness
of monetary policy has steadily grown since the establishment of the Federal
Reserve in 1913 and since the Gold Standard was abandoned.
Second, counter-cyclical fiscal policies have
replaced balanced budget philosophies, meaning that in times of economic
slowdown the government spends instead of paring back. This transformation
was perhaps best exemplified by the New Deal in 1938 and the Employment
Act of 1946, which obligated the government to manage the economy by maintaining
high employment and avoiding severe fluctuations in the financial markets.
Finally, a formal recognition of the interdependence
of the global economic system has led to the creation of organizations
devoted to global economic stability and promoting global trade. The Marshall
Plan (1948) was clearly a watershed event, allowing the large German economy
to eventually regain its footing after 3 decades of stagnation following
WWI. Global trade and stability have been further advanced by organizations
such as the WTO, the World Bank, the IMF, and trade agreements such as
GATT and NAFTA.
While the asset bubble of the late-1990s will
likely take more time to fully work through, the structural environment
remains supportive of a healthy global economic system. The policy mistakes
made during the Great Depression, or more recently in Japan, have not
been repeated, and will allow an eventual recovery in economic growth
and financial markets.
Bear market duration
One notable feature of the current decline
is its length. This is the first time we have experienced consecutive
annual declines in the equity market since 1973–1974, and only the
second since WWII (Figure 7).
Figure 7
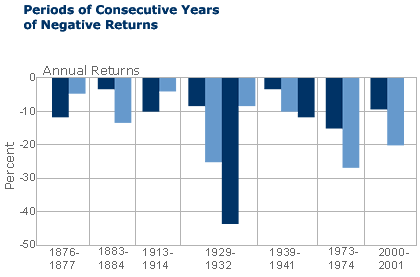
When looked at in annual performance terms,
there have been 37 negative years over the 130-year history. Of these
negative years, 20 were single-year declines, 5 were 2-year declines,
one was a 3-year decline, and one was a 4-year decline (the Great Depression),
a total of 27 negative periods. While multi-year declines have become
rare over the last 50 years, they are not rare from a longer-term historical
perspective. The probability of having a negative year has been 28% (37
negative years out of 130 total years). The probability of a one-year
decline stretching into a multi-year decline was fully 26% (7 of the 27
negative periods were multi-year), meaning that the probability of having
a positive year is not increased in the year following a decline. This
is certainly a counterintuitive notion to those primarily familiar with
the past 20 years of market performance, where down markets tended to
be short and sharp and to provide great buying opportunities after the
initial decline.
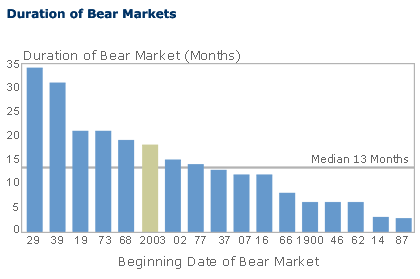
Figure 8 ranks past bear markets since
1900 by their duration (in months). At 19 months, the 2000–2001
decline ranks as the sixth longest since 1872, and the third longest since
WWII. The median duration of the declines was 14 months, and they ranged
from 3 months (1987) to 34 months (1929–1932) in length. There is
a strong historical correlation between the magnitude of a bear market
and its duration. While this may seem an obvious comment now, many believed
that the crash of 1987 had severed this relationship. Of those bear markets
that had market declines exceeding 30%, the median duration of decline
was 21 months.
Figure 8
Causes of bear markets
Since stock prices depend on the discounted
value of projected earnings, bear markets result from either a severe
contraction in earnings expectations or a rise in the discount rate, due
either to an increase in risk aversion among investors or a spike in inflation
expectations. While most corrections and mild bear markets result from
normal business cycle fluctuations, severe bear markets typically have
been related to either wars, asset bubbles, or supply shocks to the economy.
In many cases these economic disturbances were amplified by significant
mistakes in economic policy setting.
The period from 1929–1942 combined all
of these causes to produce an unprecedented period of economic and financial
market stagnation. After beginning its initial decline in August 1929,
the S&P did not return to its peak until January of 1945. This period
also contained 3 of the 4 worst bear markets in the 130-year history:
August 1929–June 1932, March 1937–March 1938, and September
1939–April 1942. From 1930–1932 earnings declined over 30%
for 3 consecutive years, for a cumulative decline of 75%. This earnings
decline explained most of the 83% decline in the equity market between
August 1929 and June of 1932. The 50% equity market decline in 1937–38
was accompanied by a 43% contraction in earnings.
Similar to the current environment, the bear
market of 1973–1974, which lasted 21 months, was rather choppy,
with several strong rallies punctuating the overall decline in the market.
The bear market of 1973–1974 started in January of 1973, with tightening
central bank policy to stem the tide of rising inflation resulting from
the lifting of wage and price controls. In October of that year, the Arab
oil embargo further accelerated the pace of inflation. It was not until
20 months into the downturn that the market experienced its sharpest declines,
as the Watergate scandals led to the Nixon’s resignation. The market
finally turned up in the fourth quarter of 1974 when the Fed began easing
interest rates. Industrial production, which began to slow in early 1973,
continued to decline for 2 years. Earnings growth was positive for the
1973–1974 period, and declined 12% in 1975.
The 2000–2001 bear market has combined
a severe contraction in earnings with the bursting of an asset market
bubble. Our current best estimate is for earnings to decline by 45% from
their peak in mid-2000. This makes the 2000–2001 market decline
the third worst from an earnings perspective, and the worst since the
Great Depression.
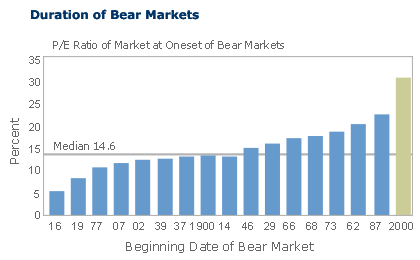
As Figure 9 shows, the P/E ratio on
the market going into this correction was significantly higher than in
any prior bear market. The average P/E ratio for the 130-year period was
15x trailing year reported earnings. The average P/E going into a bear
market has been 18x, as 10 of the 16 bear markets had above-average P/E
ratios at their inception. At 31x earnings, the P/E going into the current
bear market was significantly higher than the 23x earnings preceding the
crash in 1987, which had been the prior record for highest P/E going into
a bear market. The 2 other bear markets preceded by P/Es exceeding 20x
were August 1929–June 1932 and December 1961–June 1962. Interestingly,
there has been no historical correlation between the magnitude of the
market decline and the initial P/E ratio going into the decline.
Figure 9
Since the valuation of any asset depends on
interest rates, another common measure of equity market valuation is the
equity earnings yield (the inverse of the P/E ratio) minus the bond yield.
A high spread between earnings yields and bond yields indicates that stocks
are relatively inexpensive versus bonds. As Figure 10 shows, this
yield spread has averaged 2.4 since 1901. Since 1980, however, the yield
spread has decreased significantly, making stocks look more expensive
relative to their longer-term history. This dramatic decrease is largely
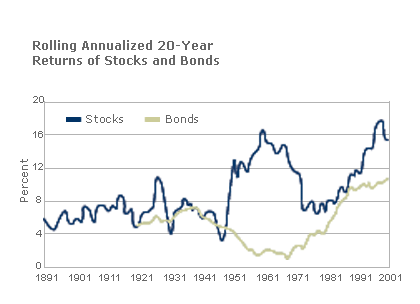
attributed to the change in relative risk of stocks and bonds. As shown
in Figure 11, bond volatility has increased meaningfully since
the early 1980s, while stock volatility has trended lower.
Figure 10
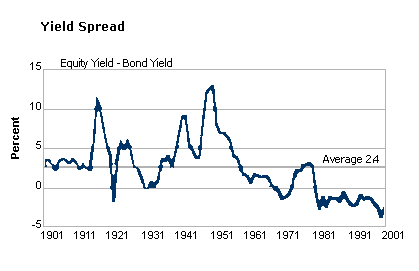
Figure 11
Bear markets are typically associated with
valuation contraction. All but two of the 16 bear markets experienced
contractions in P/E ratios during the bear market (meaning stock prices
fell more than earnings). The average decline in P/E ratios was –27%,
resulting in a median trough P/E of 13x earnings. Prior to the most recent
downturn, the highest P/E at the end of a bear market was 16.5x, in 1962.
Valuation contraction so far has been rather muted, partly due to the
severity of the earnings decline. Valuations have declined from 31x in
March 2000 to 27x at the end of September 2001.
Recovery
Not surprisingly, bear markets typically end
in rather sharp recoveries. In fact, from 1872 to 2001,5 of the 6 best
years in the equity market were in years following negative annual returns.
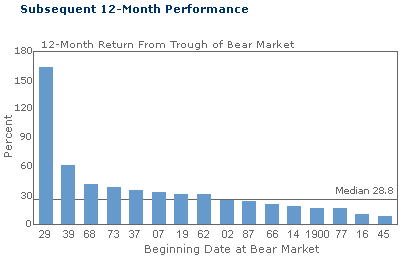
The median 12-month equity return following the end of a bear market has
been 29% (Figure 12). Only one of the 16 bear markets, 1946–1947,
was followed with a sub-10% subsequent 12-month return. The 12-month return
following the bottom of the Great Depression was a record 163%. Unfortunately
this rally reversed only a fraction of the losses over the prior 3 years.
Not surprisingly, there is a correlation between the size of the decline
and the strength of the recovery.
Figure 12
Not only is the reversal following bear markets
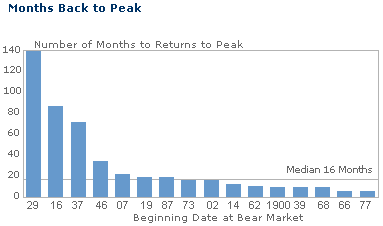
typically sharp—it also tends to be sustained. The average return
in the second year following a bear market was a healthy 19%. While the
average bear market lasted 13 months, the average time to return to the
peak was 16 additional months (Figure 13).
Figure 13
With the S&P 500 up 19% from September
21, 2001 to the end of the year, we have already seen a dramatic rebound
in the equity market. The ability to sustain this recovery will largely
depend on the timing and strength of the recovery in earnings. Without
an improvement on the earnings front, high valuations may prove difficult
to sustain, despite current low rates of interest.
Sources |
|
Asset Class |
Investment Return |
Cash |
1872–2001, 90-Day U.S. Treasury Bills |
Bonds |
1976–2001, Lehman Brothers Govt/Credit Bond Index |
|
1973–1975, Lehman Brothers Aggregate Bond Index |
|
1969–1972, Salomon Brothers High Grade Corp Bond Index |
|
1901–1968, High Grade Corp Bond Index (Source S&P) |
Stocks |
1926–2001, S&P 500 Composite Index |
|
1872–1925, Cowles Commission All Stocks Index |
Inflation |
1872–2001, Consumer Price Index, All Urban Consumers |